Overview
Below are some of the software projects I created or maintain. You can click on cards to go directly to the GitHub repository.


GitHub cards provided by gh-card.
Scientific software
crystals - Data structures for crystallography


crystals is a fully-tested Python package containing data structures representing abstract crystals. Parsing from structure files (e.g. CIF, PDB) is made easy, as is symmetry-determination through the SPGLIB package.
Here’s a quick example:
>>> from crystals import Crystal
>>>
>>> vo2 = Crystal.from_database('vo2-m1')
>>> print(vo2)	   # Short string representation
< Crystal object with following unit cell:
    Atom O  @ (0.90, 0.79, 0.80)
    Atom O  @ (0.90, 0.71, 0.30)
    Atom O  @ (0.61, 0.31, 0.71)
    Atom O  @ (0.39, 0.69, 0.29)
    Atom O  @ (0.61, 0.19, 0.21)
    Atom O  @ (0.10, 0.29, 0.70)
    Atom O  @ (0.10, 0.21, 0.20)
    Atom O  @ (0.39, 0.81, 0.79)
    Atom V  @ (0.76, 0.03, 0.97)
    Atom V  @ (0.76, 0.48, 0.47)
    ... omitting 2 atoms ...
Lattice parameters:
    a=5.743Å, b=4.517Å, c=5.375Å
    α=90.000°, β=122.600°, γ=90.000°
Chemical composition:
    O: 66.667%
    V: 33.333%
Source:
    (...omitted...)\crystals\cifs\vo2-m1.cif >
>>>
>>> print(vo2.symmetry())
{'international_symbol': 'P2_1/c',
'hall_symbol': '-P 2ybc',
'hm_symbol': 'P121/c1',
'international_number': 14,
'hall_number': 81,
'international_full': 'P 1 2_1/c 1',
'pointgroup': 'C2h'}
To install from PyPI:
> python -m pip install crystalsFor Anaconda users, crystals is also available on the conda-forge channel:
> conda install -c conda-forge crystalsiris-ued - Interactive exploration of ultrafast electron scattering data


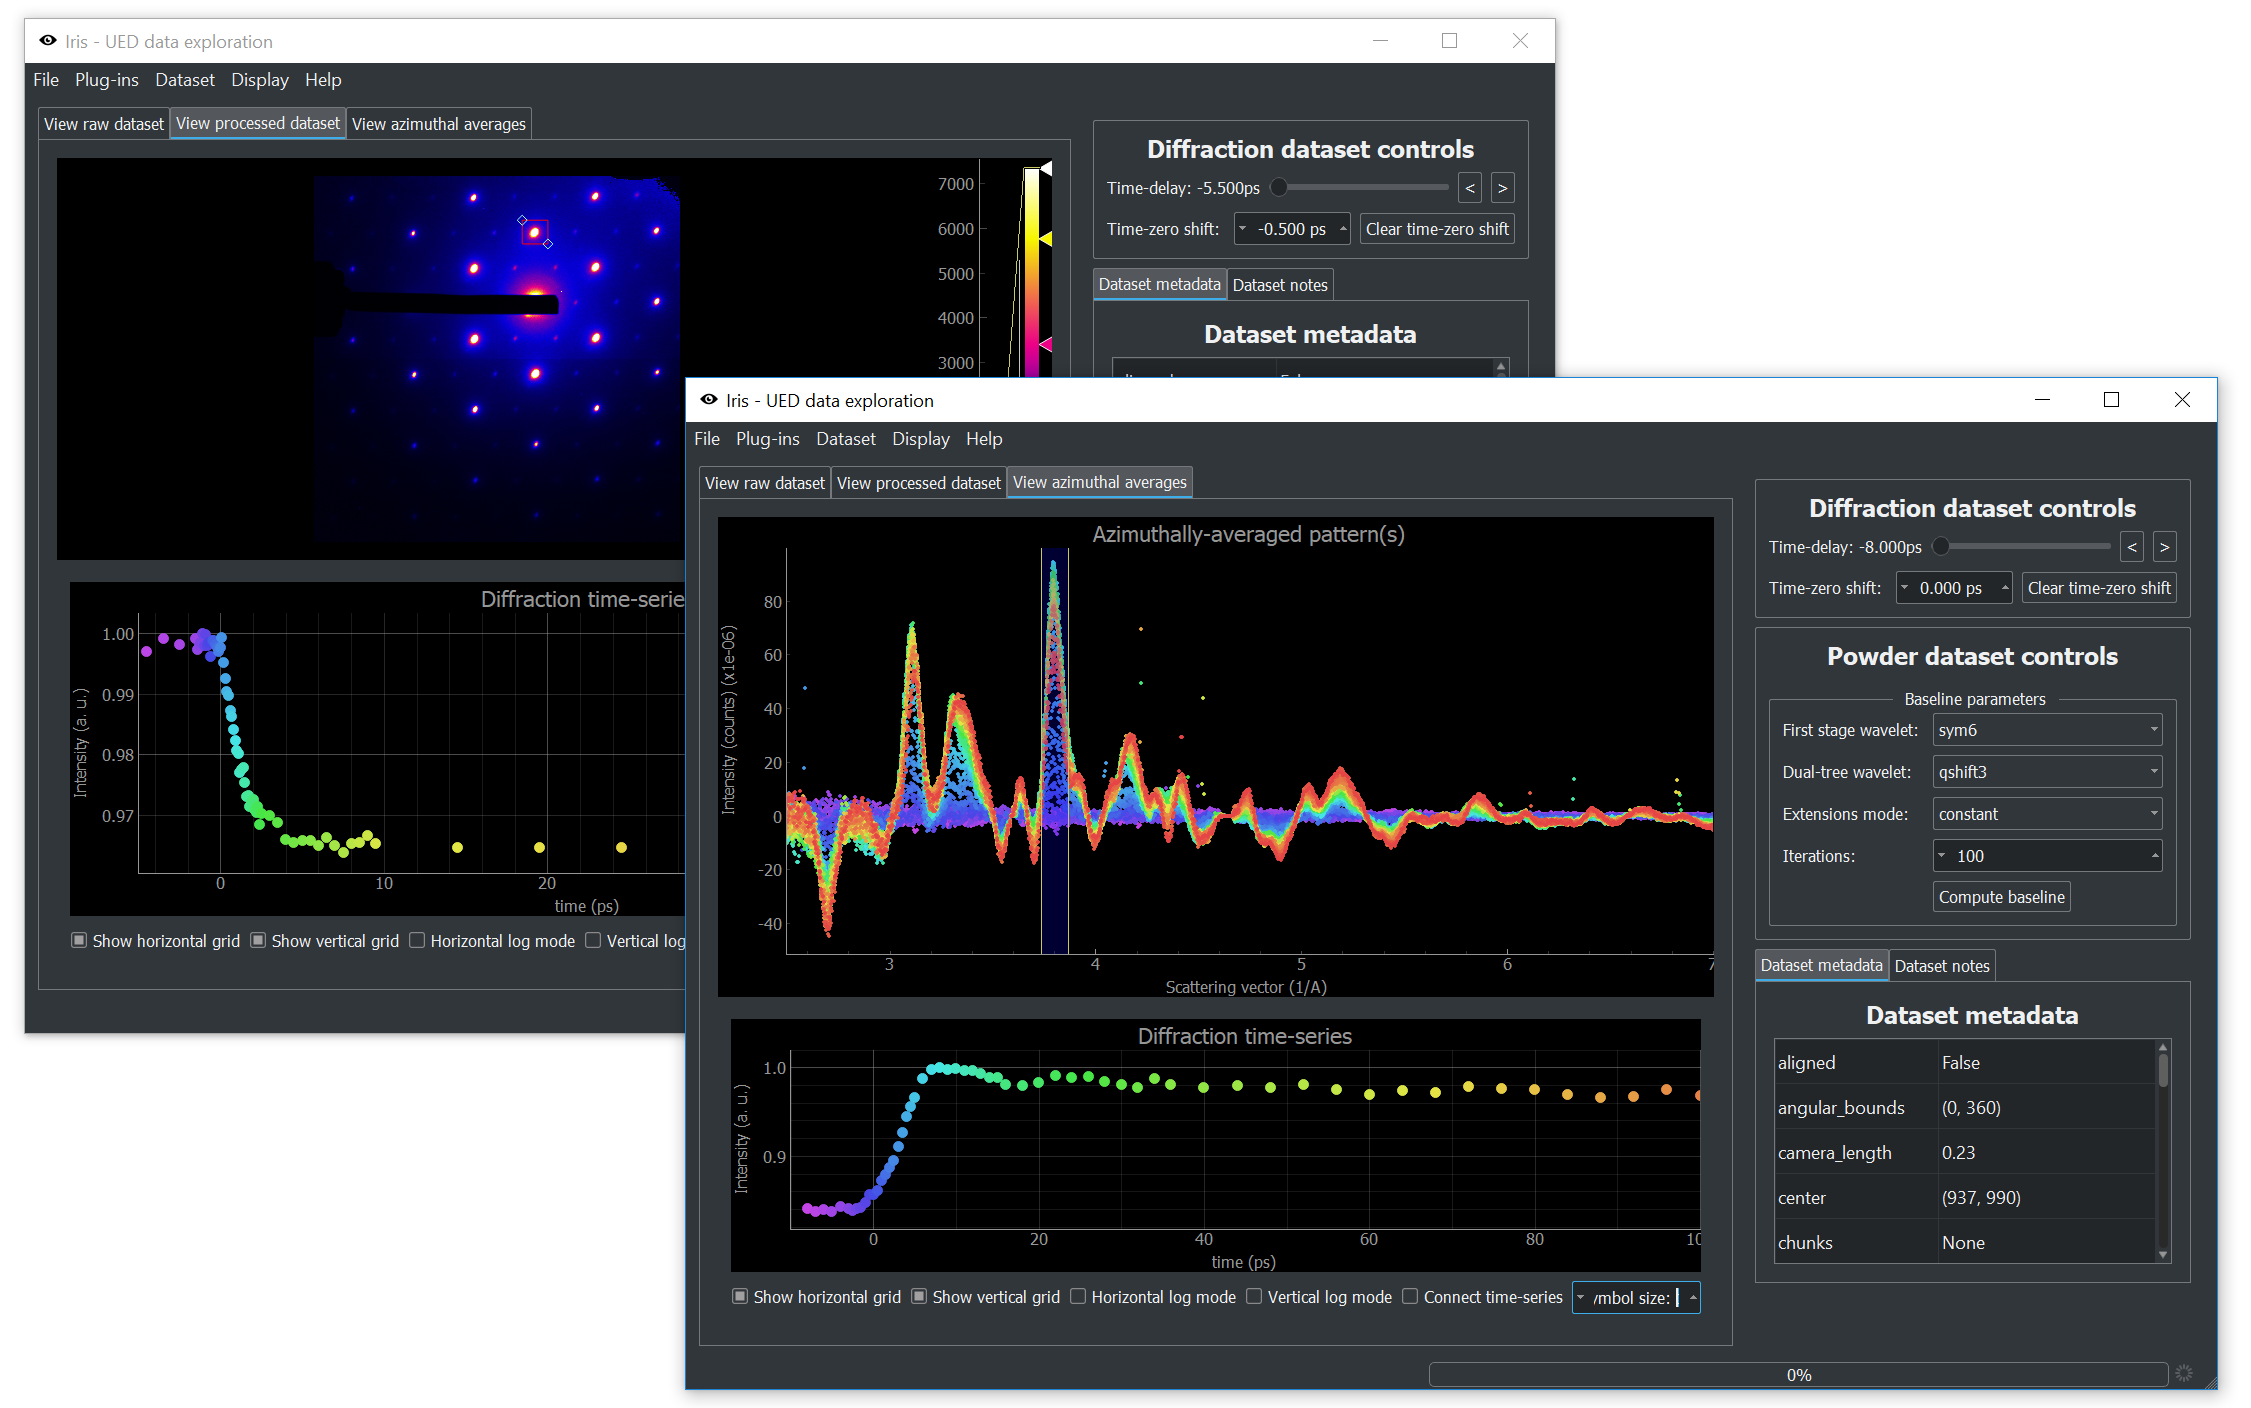
Ultrafast electron diffractometer generates huge amounts of data in the forms of image stacks. While processing this data is generally straightforward, the sheer size of datasets is always a problem. Even once the data is combined into a single time-series of images, we are still looking at multiple gigabytes of data.
Iris allows us to interactively look at this data by slicing diffraction patterns (and powder patterns) through time. Making use of our baseline-removal routine based on the dual-tree complex wavelet transform, we can look at publication-quality data minutes after data collection is complete. While each new experiment ultimately requires different tools, our investigations always start with Iris.
The latest version of Iris includes a plug-in manager. You can write your own plug-in to interact with raw, unprocessed ultrafast electron diffraction data and explore it.
To install from PyPI:
> python -m pip install iris-uedFor Anaconda users, iris-ued is also available on the conda-forge channel:
> conda install -c conda-forge iris-uednpstreams - Streaming operations on NumPy arrays


npstreams is an open-source Python package for streaming NumPy array operations. The goal is to provide tested routines that operate on streams of arrays instead of dense arrays.
Streaming reduction operations (sums, averages, etc.) can be implemented in constant memory, which in turns allows for easy parallelization. Some routines in npstreams are parallelized in this way. In our experience, this approach has resulted in huge speedups when working with images; the images are read one-by-one from disk and combined/processed in a streaming fashion, in parallel.
To install from PyPI:
> python -m pip install npstreamsFor Anaconda users, npstreams is also available on the conda-forge channel:
> conda install -c conda-forge npstreamsrepa - Regular parallel arrays in Haskell

The repa package provides high-performance, regular, multi-dimensional, shape-polymorphic arrays. Functions written with the repa combinators are automatically evaluated in parallel if possible.
The foundation of repa is described in the following publication:
Ben Lippmeier, Manuel Chakravarty, Gabriele Keller, and Simon Peyton Jones, Guiding parallel array fusion with indexed types, Proceedings of the 2012 Haskell Symposium (2012) DOI:10.1145/2364506.2364511
scikit-ued - Algorithms and data structures related to ultrafast electron scattering


scikit-ued is a fully-tested Python package containing routines and algorithms related to (ultrafast) electron diffraction. The package aims to provide software to deal with simulation, structure manipulation, image-analysis, baseline-determination, and more.
To install from PyPI:
> python -m pip install scikit-uedFor Anaconda users, scikit-ued is also available on the conda-forge channel:
> conda install -c conda-forge scikit-uedGeneral purpose software
Beam framework - A type-safe SQL library for Haskell

Beam is a type-safe Haskell interface to relational databases, such as PostgreSQL and SQLite.
Cloud Haskell - A Haskell framework for distributed computing

Cloud Haskell is a framework based on the research article Toward Haskell in the Cloud. It allows to build distributed systems using the Actor model, popularized by Erlang, while taking advantage of Haskell’s type-safety.
hakyll-images - Hakyll utilities to deal with images

hakyll-images is suite of utilities to deal with images in the context of Hakyll.
hakyll-images, at this time, allows to compress JPEG images by re-encoding them at a lower quality. Further features are planned, namely image-resizing and image-scaling.
hakyll - Hakyll - a static site generator

hakyll is a static website compiler written in Haskell. It is used to generate many blogs within the Haskell community, including this one!
javelin - A Haskell implementation of series, or one-dimensional labeled arrays

Series implemented in the javelin package are a hybrid between arrays and associative maps.
Like containers’s Map, Series support efficient:
- random access by key ( );
- slice by key ( );
Like vectors’s Vector, Series support efficient:
- random access by integer index ( );
- slice by integer index ( );
- numerical operations as fast as contiguous arrays;
pandoc-plot - A Pandoc filter to generate figures directly in documents, using your plotting toolkit of choice


pandoc-plot is a Pandoc filter that allows to keep documents and figures always in sync. Write plotting code to make a figure in your Markdown , and pandoc-plot will generate the figure for you and embed it in the document. This way, your documents and figures are always up-to-date with each other.
pandoc-plot supports many plotting toolkits, including matplotlib, MATLAB, GNU Octave, ggplot2, Julia’s Plots.jl, and many more! See the website for examples and documentation.
tree-sitter-haskell-literate - A Tree-sitter grammar for Literate Haskell
tree-sitter-haskell-literate is a Tree-sitter grammar for Literate Haskell, allowing to parse and highlight Literate Haskell files. You can use it to highlight Literate Haskell files in editors such as Helix.