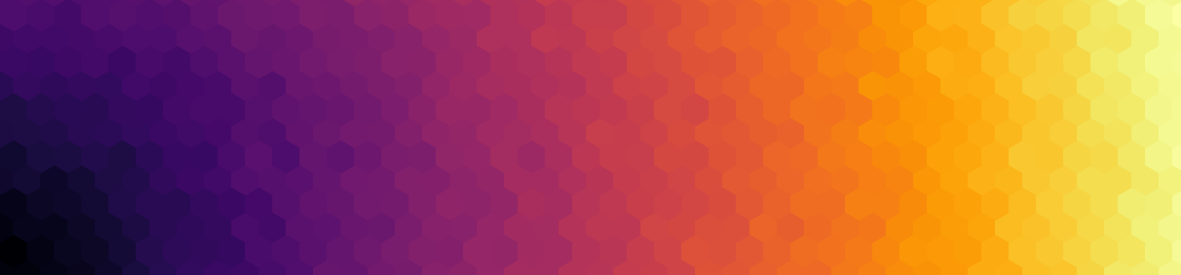
In this post, I will show you how I generated the banner for this website using Matplotlib. In case it disappears in the future, here is an image of it:
Matplotlib is a plotting library for python, historically inspired by the plotting capabilities of MATLAB. You can take a look at the various examples on their website. One thing that is not immediately obvious is that you can use Matplotlib to also draw shapes! In this sense, Matplotlib becomes a graphic design library.
(You can see the exact source code for the images below by clicking on the link in the caption)
Basic shapes
Let’s start at the beginning: drawing a single hexagon.
import matplotlib.patches as patches

def draw_hexagon(ax, center, radius, color="w"):
    ax.add_patch(
        mpatches.RegularPolygon(
            xy=center,
            numVertices=6,
            radius=radius,
            facecolor=color,
            edgecolor="k",
            orientation=0,
            fill=True,
        )
    )
Using the function, we can draw a tiling of hexagons. Let’s first set-up our plot:
import math
import numpy as np
import matplotlib.pyplot as plt

# Note that Matplotlib figure size is (width, height) in INCHES...
# We want it to be 100mm x 100mm
mm_to_in = 0.03937008
figure, ax = plt.subplots(1,1, figsize=(100 * mm_to_in, 100*mm_to_in))

# Hide as much of the axis borders/margins as possible
ax.axis("off")
plt.subplots_adjust(top=1, bottom=0, left=0, right=1)
ax.set_xlim([0, 100])
ax.set_ylim([0, 100])

# Hexagon radius in mm
radius = 4

# Dimensions of the bounding box of the hexagons
width = math.sqrt(3) * radius
height = 2 * radius
Tiling
We note that a tiling of regular hexagons requires a different offset for every row. If you imagine rows being numbered starting at 0, hexagons in rows with odd indices need to be offset by , where is the radius (or distance from the center to vertex). To find the centers of the hexagons, the following loop does the trick:
import itertools

centers = list()

for offset_x, offset_y in [(0, 0), (width / 2, (3 / 2) * radius)]:

    rows    = np.arange(start=offset_x, stop=105, step=width)
    columns = np.arange(start=offset_y, stop=105, step=3 * radius)

    for x, y in itertools.product(rows, columns):
        centers.append( (x,y) )
Once we know about the centers of the hexagons, we can place them one-by-one:
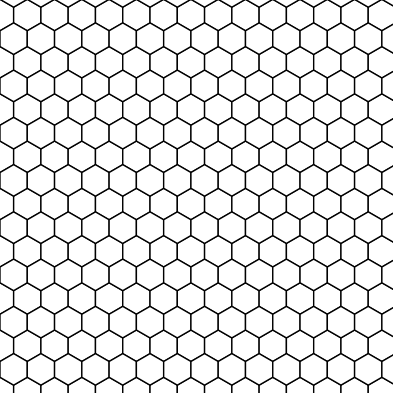
for (x,y) in centers:
    draw_hexagon(ax, center=(x,y), radius=radius)
Here’s what it looks like so far:
Color
The figure above has the wrong dimension, but you get the idea. Let’s color the hexagons appropriately. In the banner, the color of the hexagons is based on the “inferno” colormap. The color radiates away from the bottom left corner:
def draw_hexagon(ax, center, radius, color='w'):
    ax.add_patch(
        mpatches.RegularPolygon(
            xy=center,
            numVertices=6,
            radius=radius,
            facecolor=color,
            edgecolor="none", #note: edgecolor=None is actually the default value!
            orientation=0,
            fill=True,
        )
    )

colormap = plt.get_cmap('inferno')
for (x,y) in centers:
    # radius away from bottom left corner
    # proportional to the distance of the top right corner
    # i.e. 0 < r < 1
    r = math.hypot(x, y) / math.hypot(100, 100)
    draw_hexagon(ax, center=(x, y), radius=radius, color=colormap(r))
Here’s the result:
Because of rounding errors of the hexagon dimensions, there is some visible spacing between the hexagons. To get rid of it, we draw the hexagons a bit larger (0.2 millimeters):
def draw_hexagon(ax, center, radius, color='w'):
ax.add_patch(
mpatches.RegularPolygon(
xy=center,
numVertices=6,
radius=radius + 0.2,
facecolor=color,
edgecolor="none",
orientation=0,
fill=True,
)
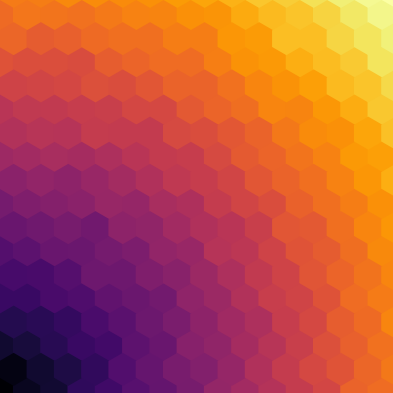
)A bit of randomness
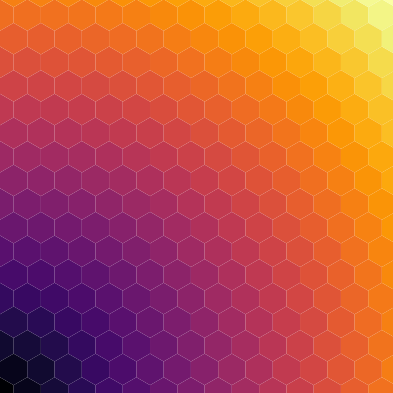
For a light touch of whimsy, I like to make the color fluctuate a little:
import random

colormap = plt.get_cmap('inferno')
for (x,y) in centers:
    # radius away from bottom left corner
    # proportional to the distance of the top right corner
    # i.e. 0 < r < 1
    r = math.hypot(x, y) / math.hypot(100, 100)
    r += random.gauss(0, 0.01)
    draw_hexagon(ax, center=(x, y), radius=radius, color=colormap(r))
We arrive at the final result:
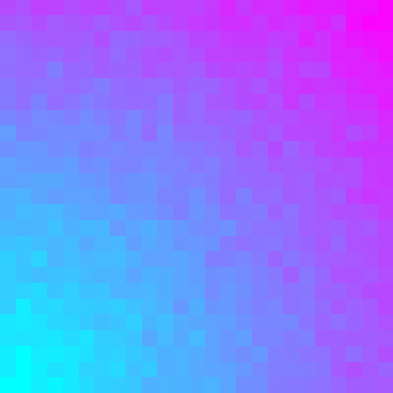
You can imagine adapting this approach to different tilings, and different colors schemes. Here’s a final example using squares and the “cool” colormap: